Handy dataLayer debugging tool for Chrome
One of those posts that were laying around on my drafts and that I've decided to publish. I know there're out there some good and well stablished tools that helps you to debug your Google Tag Manager implementation like the dataSlayer extension. But in the previous months I've been using a little JavaScript snippet that allows me to view in easy way the pushes that are being sent to Google Analytics in real-time in a nice way:
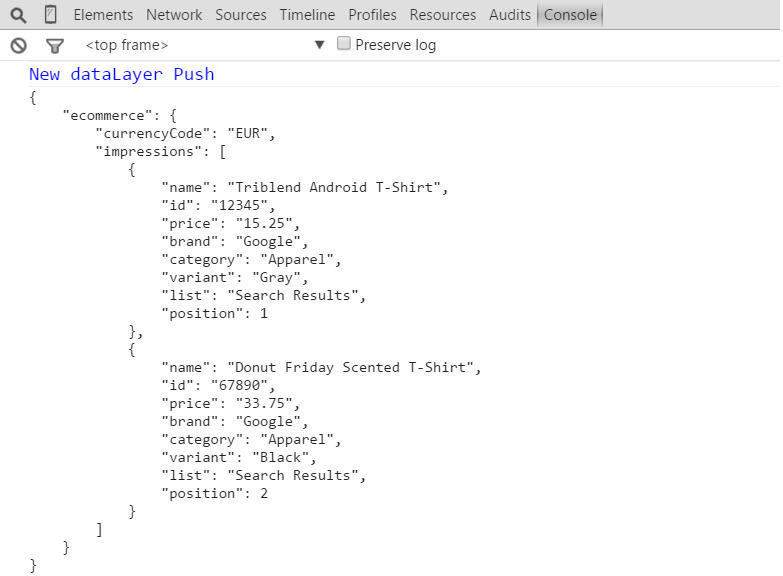
This is how the debugging will looks like:
It works for Chrome +36, and it's based on a few lines of code, to start using it you'll just need to paste those lines into your browser console, and you'll start seeing any new dataLayer pushes that are sent for the current loaded page:
Object.observe(dataLayer, function(c) {
    for(i=0;i<c.length;i++)
    {
	if(c[i].type=="add")
	{
            console.log("%cNew dataLayer Push\n", "color: blue; font-size:15px;");
	    console.log(JSON.stringify(c[i].object[c[i].name], null, '\t'));
	}
    }
});
You can grab the code too from this gitHub repository: https://github.com/thyngster/universalanalytics/blob/master/datalayer_monitor.js
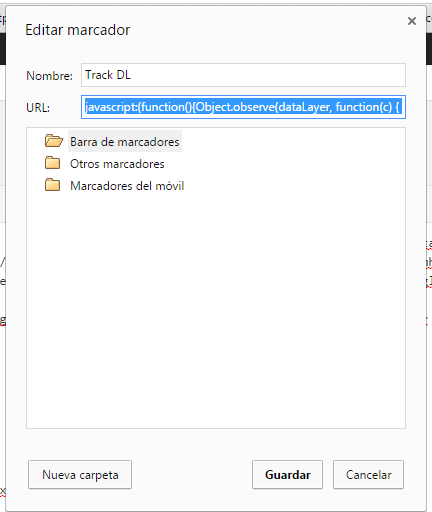
A nice way to have this little debugger at hand is to add a new bookmark in Chrome and set the URL to this piece of code. From then on, clicking on the bookmark will enable the debugging for the current loaded page
javascript: (function() {
    Object.observe(dataLayer, function(c) {
        for (i = 0; i < c.length; i++) {
            if (c[i].type == "add") {
                console.log("%cNew dataLayer Push\n", "color: blue; font-size:15px;");
                console.log(JSON.stringify(c[i].object[c[i].name], null, '\t'));
            }
        }
    });
})();
Not the best debugging tool, but pretty handy, hope someone finds it useful at some point.

