Performance Timing tracking with Google Analytics 4
I'm really obsessed with performance, while I may not be the best on that task I'm a real tryhard on that topic, at least up to where my knowledge allows me. And this said, I really miss the Site Speed Report on Google Analytics 4.
This is why I replicated the current metrics and logic from Universal Analytics, and I sharing it with you on this post. If you end implementing this tracking you'll have the following metrics avaiable in for your use, for example in data studio.
The current provided code, will even allow you to set a siteSpeedSampleRate as Universal Analytics.
Code Snippet
<script>
(function() {

    var siteSpeedSampleRate = 100;
    var gaCookiename = '_ga';
    var dataLayerName = 'dataLayer';

    // No need to edit anything after this line
    var shouldItBeTracked = function(siteSpeedSampleRate) {
        // If we don't pass a sample rate, default value is 1
        if (!siteSpeedSampleRate)
            siteSpeedSampleRate = 1;
        // Generate a hashId from a String
        var hashId = function(a) {
            var b = 1, c;
            if (a)
                for (b = 0,
                c = a.length - 1; 0 <= c; c--) {
                    var d = a.charCodeAt(c);
                    b = (b << 6 & 268435455) + d + (d << 14);
                    d = b & 266338304;
                    b = 0 != d ? b ^ d >> 21 : b
                }
            return b
        }
        var clientId = ('; ' + document.cookie).split('; '+gaCookiename+'=').pop().split(';').shift().split(/GA1\.[0-9]\./)[1];
        if(!clientId) return !1;
        // If, for any reason the sample speed rate is higher than 100, let's keep it to a 100 max value
        var b = Math.min(siteSpeedSampleRate, 100);
        return hashId(clientId) % 100 >= b ? !1 : !0
    }

    if (shouldItBeTracked(siteSpeedSampleRate)) {
        var pt = window.performance || window.webkitPerformance;
        pt = pt && pt.timing;
        if (!pt)
            return;
        if (pt.navigationStart === 0 || pt.loadEventStart === 0)
            return;
        var timingData = {
            "page_load_time": pt.loadEventStart - pt.navigationStart,
            "page_download_time": pt.responseEnd - pt.responseStart,
            "dns_time": pt.domainLookupEnd - pt.domainLookupStart,
            "redirect_response_time": pt.fetchStart - pt.navigationStart,
            "server_response_time": pt.responseStart - pt.requestStart,
            "tcp_connect_time": pt.connectEnd - pt.connectStart,
            "dom_interactive_time": pt.domInteractive - pt.navigationStart,
            "content_load_time": pt.domContentLoadedEventStart - pt.navigationStart
        };
        // Sanity Checks if any value is negative abort
        if (Object.values(timingData).filter(function(e) {
            if (e < 0)
                return e;
        }).length > 0)
            return;
        window[dataLayerName] && window[dataLayerName].push({
            "event": "performance_timing",
            "timing": timingData
        })
    }
}
)()
</script>
Setting up GTM
The first thing we need to do it adding the following code snippet above in a Custom HTML tag in Google Tag Manager, that fired on the Window Load event.

Outcome
The code we added above will kindly push all the performance timing data in a nicely formated dataLayer push, that we later use to pass the data to any tag/vendor we want. In our case we'll pushing the data to a GA4 event tag.
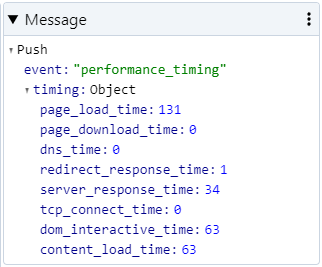
{
	event: 'performance_timing',
	timing: {
		page_load_time: 131,
		page_download_time: 0,
		dns_time: 0,
		redirect_response_time: 1,
		server_response_time: 34,
		tcp_connect_time: 0,
		dom_interactive_time: 63,
		content_load_time: 63
	}
}
Setting GA4 Event Tag
Now that we have all the data being push to the dataLayer, we'll need to create a new GA4 event Tag and maps all the data accordingly, please refer to the following screenshot for all the details.

Custom Metrics definition in Google Analytics 4
As you already know, sending a parameter within an event doesn't mean anything until we map it to a dimension within our property.
For this we need to go to the Custom Definitions > Custom Metrics, and add all this new parameters with the event scope and Milliseconds as the Unit of Measurement.

How to view the data
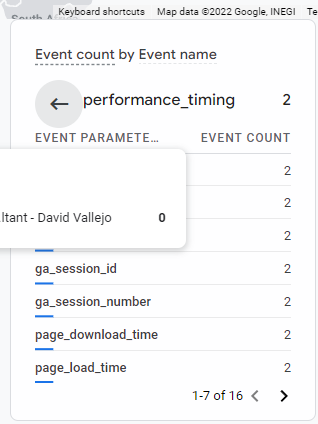
Now that we started collecting the data, we have some different ways to view it, we could use the GA4 reports ( which will be limiting the reporting possibilities a lot )
Using the Google Analytics Exploration
Using Data Studio
This is my prefered option, you can create AVG metrics in an easy way, AVG metrics in Seconds to match the reports on Universal Analytics.
For example, I tried to quickly replicate the Universal Site Speed reports using Data Studio without almost no time.

Using Big Query
Lastly, if you're one of the brave analysts around the world, the good news is that the possibilities are now almost enless, is just up to you to play around with this and paint it anywhere you want.
As a simple example, let's find out how many and which pages took more than 1 second to load.
SELECT * ,
   FROM `thyngster.*********.events_20220712`
   WHERE event_name = "performance_timing" AND
   (SELECT value.int_value FROM UNNEST(event_params) WHERE key = 'page_load_time') > 1000
Metrics List
Here it goes the list of metrics you can configure and use to replicate the old Universal Analytics reports:
- Site Speed Events Count
Page Load Time(ms) and Avg. Page Load Time (sec)Domain Lookup Time(ms) and Avg. Domain Lookup Time (sec)Page Download Time(ms) and Avg. Page Download Time (sec)Redirection Time(ms) and Avg. Redirection Time (sec)Server Connection Time(ms) and Avg. Server Connection Time (sec)Server Response Time(ms) and Avg. Server Response Time (sec)Document Interactive Time(ms) and Avg. Document Interactive TimeDocument Content Loaded Time(ms) Avg. Document Content Loaded Time (sec)
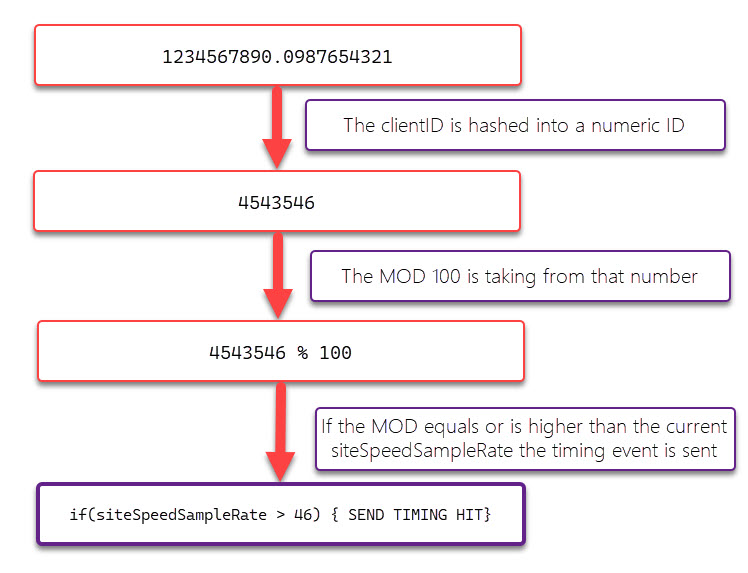
(Extra) How siteSpeedSample Works
I must confess I've never looked at this and I found pretty curious about how Universal Analytics was doing the Site Speed Sampling. I was expecting having it doing a sampling based on hit, but currently the sampling is done on users ( devices ).
This means that rather than getting details about a 5% of the pageviews, you're getting the details about the 5% of your visitors instead.
Universal Analytics has been relying on the clientId value to determine if the current user should be sending the timing details.